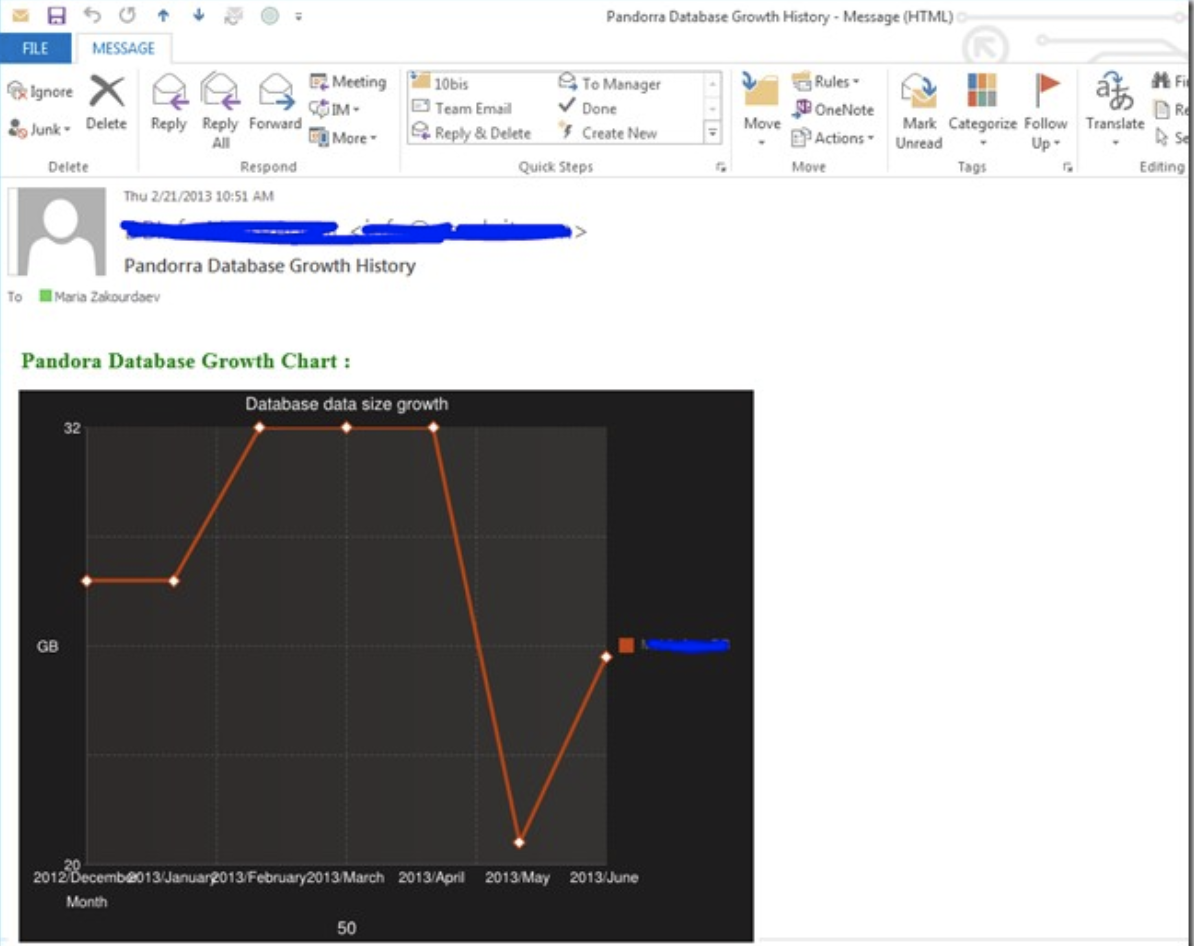
Alert visualization recipe: Get out your blender, drop in some sp_send_dbmail, Google Charts API, add your favorite colors and sprinkle with html. Blend till it’s smooth and looks pretty enough to taste.

I really like database monitoring. My email inbox have a constant flow of different types of alerts coming from our production servers with all kinds of information, sometimes more useful and sometimes less useful. Usually database alerts look really simple, it’s usually a plain text email saying “Prod1 Database data file on Server X is 80% used. You’d better grow it manually before some query triggers the AutoGrowth process”. Imagine you could have received email like the one below. In addition to the alert description it could have also included the the database file growth chart over the past 6 months. Wouldn’t it give you much more information whether the data growth is natural or extreme? That’s truly what data visualization is for. Believe it or not, I have sent the graph below from SQL Server stored procedure without buying any additional data monitoring/visualization tool. Would you like to visualize your database alerts like I do? Then like myself, you’d love the